
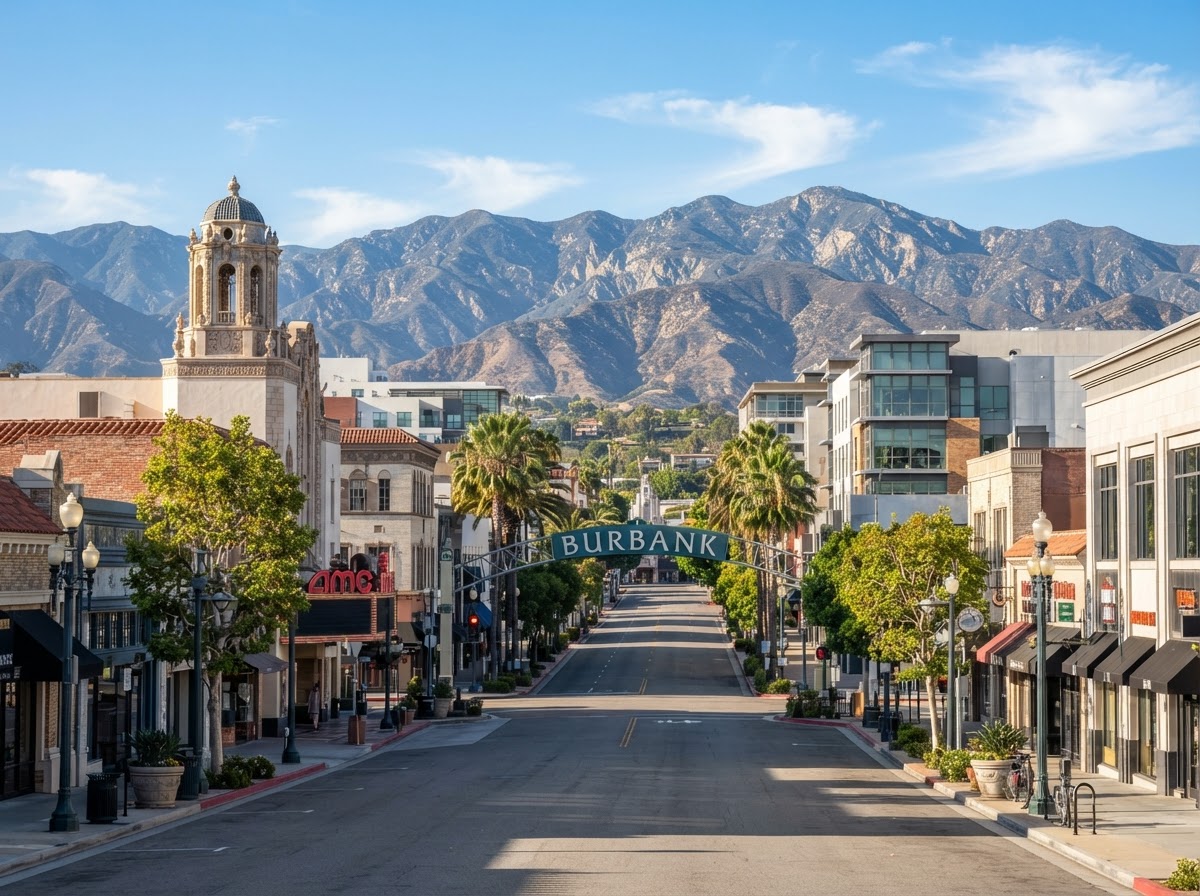
Burbank Real Estate Market Report
Burbank Housing Market Overview
Burbank is an incorporated city in the eastern San Fernando Valley within Los Angeles County, renowned as a major center for media and entertainment production. It blends quiet residential neighborhoods with thriving commercial districts and major employment hubs, including Walt Disney Studios, Warner Bros. Studios, and the Burbank Empire Center. Its housing stock includes traditional single-family residences, mid-century ranch homes, modern infill construction, character bungalows in Magnolia Park, equestrian properties in the Rancho District, hillside residences in the Burbank Hills, and contemporary condominiums and townhomes near Downtown Burbank.
The market statistics below use verified CRMLS InfoSparks data where available, supplemented by Realtor.com citywide statistics for metrics not represented in the verified CRMLS data. The interactive charts display housing market statistics, including median sales prices, days active in the MLS, months of housing supply, and price per square foot. These charts update through CRMLS and may reflect different reporting periods depending on the selected settings.
Key Burbank Housing Statistics
September 2026 · Rolling 12 Months · CRMLS InfoSparks / 10K Research — ShowingTime Plus · single family
September 2026 · Realtor.com — Burbank housing market
September 2026 · Rolling 12 Months · CRMLS InfoSparks / 10K Research — ShowingTime Plus · single family
September 2026 · Realtor.com — Burbank housing market
September 2026 · Rolling 12 Months · CRMLS InfoSparks / 10K Research — ShowingTime Plus · single family
September 2026 · Realtor.com — Burbank housing market
Burbank Market Trends
Explore Burbank housing market trends through live CRMLS InfoSparks charts. Compare median sales prices, marketing times, housing supply, and price per square foot. Charts update through CRMLS and may reflect newer reporting periods than the historical market snapshot above.
September Median Sale Price
Compares Burbank (red line) with Entire MLS (blue line).
CRMLS InfoSparks / 10k Research. Embedded live charts update through CRMLS and may display newer reporting periods than the September 2026 snapshot shown above.
Days Active in MLS
CRMLS InfoSparks / 10k Research. Embedded live charts update through CRMLS and may display newer reporting periods than the September 2026 snapshot shown above.
September Median Price Per Square Foot
CRMLS InfoSparks / 10k Research. Embedded live charts update through CRMLS and may display newer reporting periods than the September 2026 snapshot shown above.
September Inventory Months Supply
CRMLS InfoSparks / 10k Research. Embedded live charts update through CRMLS and may display newer reporting periods than the September 2026 snapshot shown above.
What the Numbers Mean
The September 2026 CRMLS InfoSparks chart reports a median sales price of $1,200,000 for Burbank single-family homes, based on a rolling 12-month period. The median listing price reflects what sellers were asking across the city before negotiation. Comparing these figures provides useful context, though analyzing matched individual transactions is necessary to determine exact negotiation spreads.
The number of active listings helps buyers evaluate available housing inventory across Burbank's varied residential districts. Higher inventory levels give buyers more properties to compare and can increase negotiating flexibility, whereas lower inventory concentrates demand among fewer available properties. Active listings should always be evaluated alongside sales velocity and months of inventory supply.
The September 2026 CRMLS InfoSparks rolling 12-month chart reports a median of 18 days active in the MLS for Burbank single-family homes, highlighting strong buyer demand and efficient market absorption relative to broader regional averages. Lower marketing times signal active demand and competitive interest for properly priced homes.
Why property condition, location, and lot size affect pricing: Citywide medians summarize the midpoint of the overall market, but individual home values depend heavily on neighborhood placement, architectural appeal, lot orientation, updates, and proximity to commercial corridors or studio campuses.
The CRMLS InfoSparks charts presented above reflect single-family residential properties. Single-family homes, condominiums, townhomes, and multi-family properties cater to different buyer segments and feature distinct price points, HOA considerations, and financing structures. A property-specific valuation isolates these property types with greater precision.
Why a personalized CMA is more accurate for an individual property: A median serves as a broad benchmark rather than an appraisal. A personalized comparative market analysis considers recent comparable sales, property condition, lot size, school district boundaries, and hyper-local demand to determine a precise market value for a specific property.
Neighborhood & Property-Type Differences
Burbank Hills and hillside residences: In the foothill areas above Glenoaks Boulevard, winding streets offer hillside homes with panoramic Valley views, larger lot configurations, and elevated price points where topography and view corridors strongly influence valuation.
Magnolia Park and character residential areas: West of Downtown Burbank, neighborhoods like Magnolia Park and the Chandler Park corridor feature tree-lined streets, mid-century ranch homes, character bungalows, and walkable access to independent shops, dining, and bike paths.
The Rancho District and specialized housing: Known for its equestrian heritage, tree-canopied streets, and large lots with horse keeping amenities, the Rancho District represents a distinctive micro-market with unique property characteristics.
These are broad geographic descriptions rather than fixed market boundaries. Individual properties can differ significantly in setting, condition, accessibility, and value, and a property-specific analysis is the most reliable way to understand how a particular home fits the current market.
Buyer Considerations
- Compare recent comparable sales for the specific property type and neighborhood micro-location rather than relying solely on citywide medians.
- Evaluate lot configuration, topography, drainage, retaining structures, and hillside conditions when evaluating foothill properties above Glenoaks Boulevard.
- Review city permit records and renovation documentation through Burbank's municipal Building & Safety Division.
- Confirm property insurance requirements early, particularly for hillside homes in higher fire hazard severity zones.
- Consider proximity to studio campuses, major arterial roads, and Hollywood Burbank Airport when balancing neighborhood convenience with traffic and acoustic factors.
Seller Considerations
- Price against recent comparable sales tailored to your specific neighborhood, property condition, and architectural style — rather than a countywide average.
- Prepare the property thoughtfully; curb appeal, staging, and property presentation play an influential role in maximizing buyer interest in competitive Burbank neighborhoods.
- Understand that listing-to-sold price margins reflect market negotiation and property positioning relative to competing inventory.
- Factor median marketing times into your timing strategy, particularly if coordinating a simultaneous home sale and purchase.
- A personalized CMA from Chana Gedy Real Estate combines local Burbank knowledge with recent comparable sales to position your property effectively.
Frequently Asked Questions
What is the median home price in Burbank?
The September 2026 CRMLS median sales price for Burbank single-family homes was $1,200,000, based on a rolling 12-month period. This represents a citywide median for single-family residential homes and is not an appraisal for a specific property.
How long do homes typically stay on the market in Burbank?
The CRMLS InfoSparks rolling 12-month chart reports a median of 18 days active in the MLS for Burbank single-family homes. Individual listings may sell faster or slower based on pricing, condition, location, and property type.
How competitive is the Burbank housing market?
Burbank remains a highly desirable market supported by strong municipal services, top-rated public schools, major studio employment, and established residential neighborhoods. A combination of low days on market and constrained inventory creates competitive conditions for well-positioned homes.
What affects home values in Burbank?
Home values are influenced by neighborhood location, lot size, property condition, architectural character, school proximity, hillside topography, and proximity to entertainment studios and commercial districts.
Are Burbank home prices increasing or decreasing?
This report presents verified September 2026 CRMLS InfoSparks and Realtor.com statistics. For detailed historical pricing trends and forward guidance tailored to your property, request a personalized comparative market analysis.
How can I determine my Burbank home's current market value?
A personalized CMA is the most accurate method to evaluate property value. It analyzes comparable sales, home improvements, micro-location, and current buyer demand. Schedule a consultation with Chana Gedy Real Estate to request one through The Gold Glove Concierge Real Estate Service®.
Sources & Data Methodology
CRMLS InfoSparks figures reflect Burbank single-family residential properties, with Entire MLS comparisons where indicated. Embedded charts are live and may display updated reporting periods. Rolling 12-month statistics reflect the preceding 12-month period at each data point rather than a single month's transactions. The September 2026 CRMLS figures referenced above reflect the charts provided as of October 30, 2026.
Realtor.com citywide statistics reflect the source's reported Burbank city boundaries and may include multiple property types. Figures reflect September 2026 market data, not live data, and are subject to periodic update.
Market statistics use verified CRMLS InfoSparks data where available, supplemented by Realtor.com neighborhood statistics for metrics not represented in the verified CRMLS data. CRMLS figures reflect single-family residential properties, with Entire MLS comparisons where indicated; Realtor.com figures reflect the source's reported neighborhood boundaries and may include multiple property types. Embedded charts are live and may display updated reporting periods. Rolling 12-month statistics reflect the preceding 12-month period at each data point rather than a single month's transactions. The September 2026 figures referenced above reflect the CRMLS charts and Realtor.com data provided as of October 27, 2026. Market conditions and statistics are subject to change. These statistics provide a general overview of market activity and should not be interpreted as an appraisal or property-specific valuation.
Explore the Burbank Community Guide
Learn about Burbank neighborhoods, architecture, parks, schools, dining, and everyday essentials.
View Burbank GuideUnderstand Your Market. Make Your Next Move with Confidence.
Every property and neighborhood is unique. Get personalized real estate guidance supported by local market knowledge and comparable sales.
The Gold Glove Concierge Real Estate Service®